Ask ten Amazon sellers what ACOS they target and most answer immediately. Ask where the number came from and the answers thin out fast. It was in a course. A previous agency used it. It sounds about right. Someone in a Facebook group said 25%.
An ACOS target that was not derived from your own margin structure is not a target. It is a number you are now optimising toward for no reason, and it will be wrong in one of two expensive directions.
How to calculate your break-even ACOS
Break-even ACOS is the point where advertising-attributed revenue exactly covers the advertising plus everything else it takes to deliver the product. Work down from retail price:
- Retail price
- Less referral fee (usually 8–15% depending on category)
- Less FBA fulfilment fee
- Less monthly storage, apportioned per unit
- Less landed COGS
- Less realistic returns cost for your category
- = contribution margin per unit
Contribution margin as a percentage of retail price is your break-even ACOS.
If a $40 product carries $16.40 of combined fees, COGS and returns cost, contribution margin is $23.60, or 59% of retail. Break-even ACOS is 59%. Every advertising dollar spent below that ratio makes money on the marginal unit.
That number surprises most sellers, and it should. A 25% target on that product is not aggressive. It is leaving a large amount of profitable volume unbought because a number from a course felt safe.
So what is a good ACOS, in actual numbers
“Derive it yourself” is the correct answer and an unsatisfying one if you came here for a figure. So here is the arithmetic run out for three representative margin structures, using published selling fees and FBA rates.
| Low-margin consumable | Mid-margin household | High-margin accessory | |
|---|---|---|---|
| Retail price | $24.00 | $40.00 | $60.00 |
| Referral fee | $3.60 | $6.00 | $9.00 |
| FBA + storage | $5.20 | $6.40 | $5.90 |
| Landed COGS | $9.00 | $12.00 | $12.00 |
| Returns allowance | $0.50 | $1.60 | $3.00 |
| Contribution margin | $5.70 | $14.00 | $30.10 |
| Break-even ACOS | 24% | 35% | 50% |
Three products that could sit in one catalogue, and any single account-wide target is wrong for all three. The consumable cannot survive the 35% the household product absorbs comfortably. The accessory is leaving profitable volume unbought at anything below 50%.
This is also why a published benchmark cannot help you. A “good ACOS is 25%” rule would have the consumable running at a loss on every marginal unit while the accessory underspends by half.
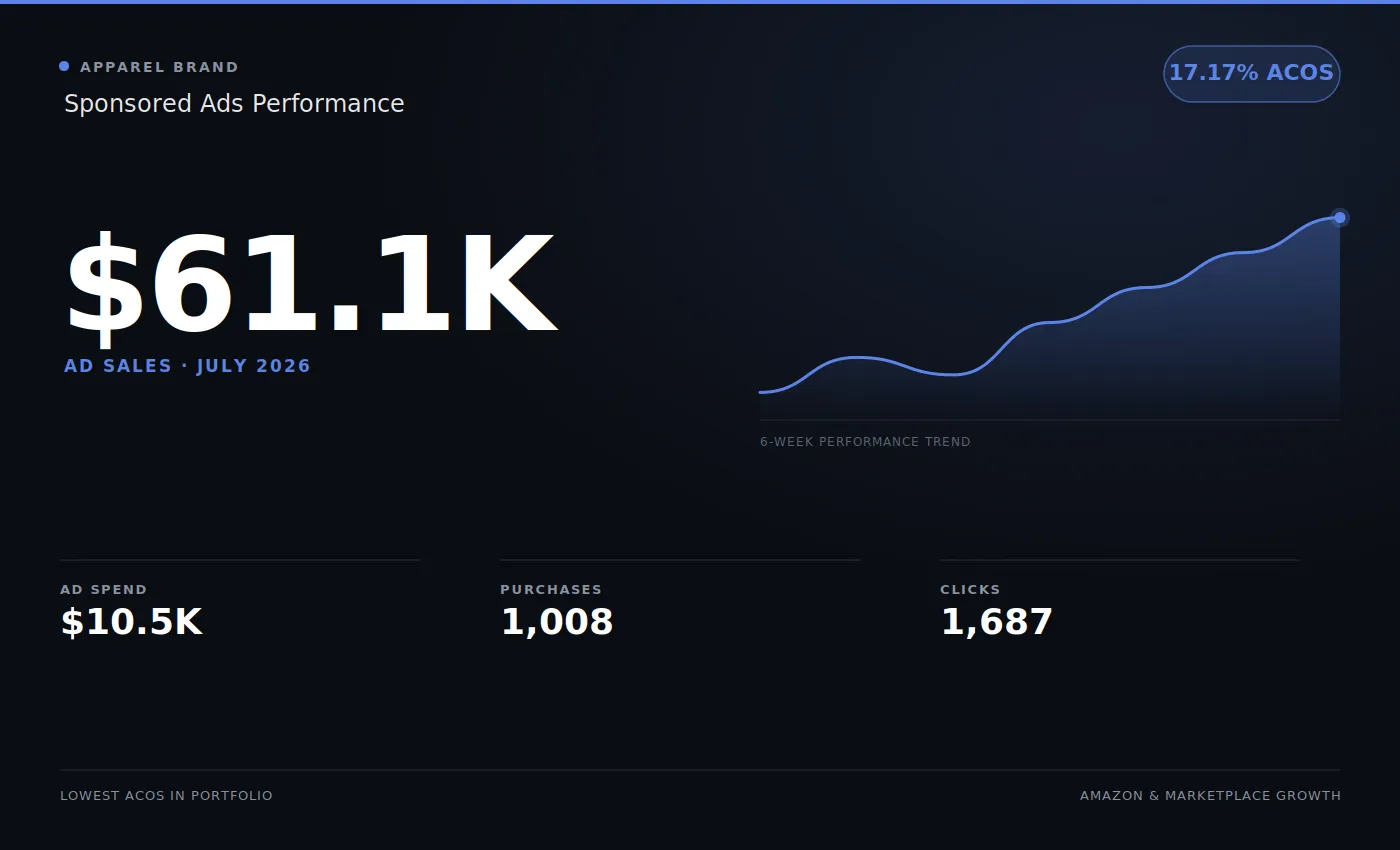
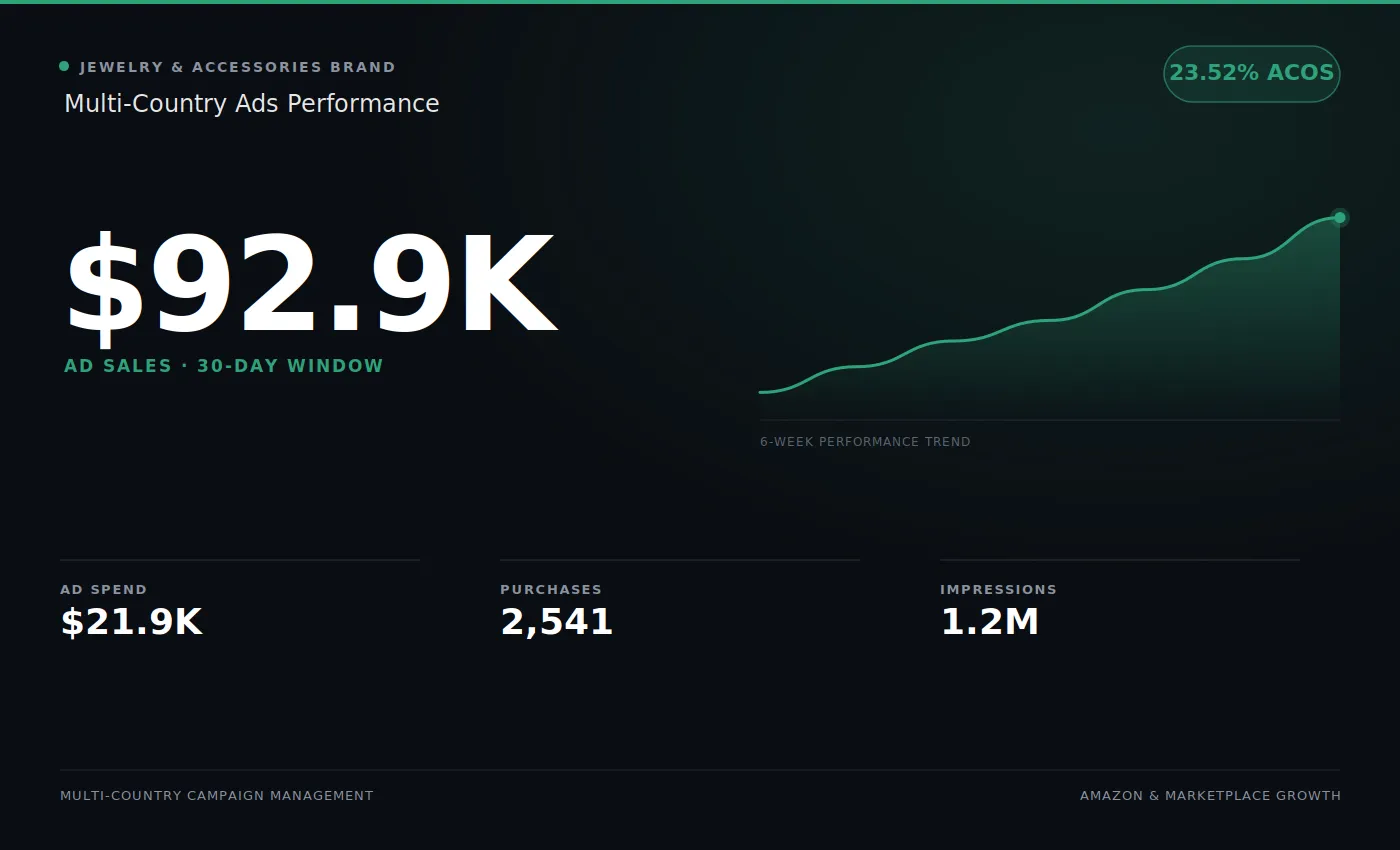
For reference against real accounts rather than worked examples: the two in my portfolio run at 17.17% and 23.52%, and both are comfortably below their respective break-even points. The gap between reported ACOS and break-even ACOS is the margin you are actually keeping — that gap is the number worth managing, not the ACOS itself.
ACOS, TACOS and ROAS answer three different questions
They get used interchangeably and they are not interchangeable.
- ACOS — ad spend ÷ ad-attributed sales. Measures campaign efficiency. Lower is not automatically better.
- ROAS — ad-attributed sales ÷ ad spend. The same relationship inverted, so higher is better. A 25% ACOS is a 4× ROAS; they contain identical information.
- TACOS — ad spend ÷ total sales, organic included. Measures how dependent the business is on advertising.
The one that answers “is the brand getting healthier” is TACOS, and it is the one least often reported. ACOS vs TACOS covers where each belongs.
Why returns decide the answer in some categories
The returns figure is the one most often omitted, and in some categories it dominates everything else.
Apparel is the clearest case. Return rates there run far above most categories, and Amazon’s reported ACOS never nets them out. The console counts the order, not what came back six weeks later. Use your own account’s return rate, not a benchmark; whatever it is, an apparel account bidding against gross margin on shipped units is systematically overbidding, and will report a healthy ACOS while losing money.
Why the same ACOS is good and bad at once
Two accounts from my own portfolio make the point better than any general rule.
The apparel brand runs at 17.17% ACOS. The jewellery brand runs at 23.52%. The jewellery account is the more profitable of the two per advertising dollar, because gross margin in jewellery is substantially higher.
Setting the jewellery account a 17% target to make the numbers match would have meant cutting bids on terms converting profitably, surrendering placement to competitors, and reporting a better-looking figure while making less money.
The target follows the margin structure of the category, every time.
The two ways a wrong target costs you
Targeting too low
Bid ceilings sit below what profitable terms are worth. Placement goes to competitors who did the maths. Organic rank, which is influenced by sales velocity, decays with it. The account reports an excellent ACOS and shrinks.
This is the more common failure, because a low ACOS looks like good management. It is very easy to be praised for it while a competitor takes the category.
Targeting too high
Spend scales into terms that were never going to pay for themselves. Because Amazon attributes generously (a 7-day or 14-day window catches purchases that would have happened anyway), the reported figures look acceptable while total profit falls. The tell is advertising sales growing faster than total account profit.
What changes once the number is real
Bids get set per product, not per account. A 60% break-even product and a 25% break-even product should never share a bid strategy, even in the same catalog.
Some campaigns get more aggressive. Almost every account I take over has profitable terms being underbid because the account-wide target was too conservative for those specific products.
Some get cut entirely. Terms that could never clear break-even stop being funded, rather than being funded slightly less.
The reporting conversation changes. “ACOS went from 28% to 24%” is not a business result. “We are buying 40% more units at a contribution margin we chose deliberately” is.
Conversion rate is inside the number
Cost per acquisition is a function of bid and conversion rate. Two products with identical bids and identical break-even ACOS produce completely different results if one converts at 8% and the other at 12%.
That means listing work is advertising work. Raising conversion rate from 8% to 11% lowers cost per acquisition by roughly 27% on unchanged bids, a better return than almost any bid adjustment available to you.
It is why I will not scale spend into a weak detail page. Buying more clicks for a page that leaks them is an expensive version of a problem you could have fixed for free. See Amazon variation listings for what that fix usually involves.
The target moves between launch and maturity
Break-even is a floor, not a plan. What you do relative to it depends on what the product is doing.
At launch, running deliberately above break-even is a legitimate decision. You are buying sales velocity, review volume and the ranking that follows, and paying for it out of a budget you have consciously set. The discipline is that it must be deliberate, capped, and time-boxed — “we will spend to 80% ACOS on this ASIN for eight weeks” is a plan; drifting there is not.
At maturity, the same product should be pulled back toward profit extraction, because the rank it was buying now sustains itself. Most accounts never make this transition. Launch budgets quietly become permanent budgets (a date-range Amazon PPC portfolio cap is the simplest guard against that), and nobody revisits the target once the product stops being new.
What actually lowers ACOS
In rough order of how much they move the number, and how few people start here:
- Conversion rate. Covered above, and still the largest available lever. It costs nothing per click.
- Search-term hygiene. Negating terms that spend and never convert. Unglamorous, and it compounds week over week.
- Match-type structure. Broad and phrase discovering, exact converting, with budgets that reflect which is which. Campaign structure covers the build.
- Placement multipliers. Top-of-search usually converts best and costs most; the multiplier is where that trade is priced, and it is often left at zero. Placement multipliers covers how to set them from your own report.
- Bids. Last, not first. Cutting bids is the lever everyone reaches for and the one most likely to buy a better-looking number by surrendering profitable volume.
Note what is not on the list: Sponsored Products and Sponsored Brands have different roles and should not be held to one shared target. Brand defence in particular will report an ACOS that looks extraordinary and tells you almost nothing, because much of it would have converted anyway.
A working sequence
- Calculate contribution margin per unit, per product, including returns.
- Convert to break-even ACOS per product.
- Decide per product whether the goal is share acquisition or profit extraction.
- Set target ACOS relative to break-even, not to a portfolio average.
- Check conversion rate before raising any bid.
- Recalculate whenever fees, COGS or price change. Amazon adjusts fees more often than most accounts adjust targets.
Most accounts skip to step four with a borrowed number. Everything downstream inherits the error.
The calculation above takes minutes. Holding an account against its own number every week is the ongoing work, which is what Amazon PPC management covers. Fees are flat rather than a percentage of ad spend, so recommending you cut a campaign costs nothing.